Loading...
Loading...
Loading...
Loading...
Loading...
Loading...
Academic researchers: provided that the original publications are properly cited, the use of www.tnmplot.com is free for scientific projects. Please see below the complete Terms of Use.
Commercial entities: the services may not be used in connection with any commercial endeavors without a valid licence. Any unlicensed use of the services is strictly prohibited, and in such cases we retain all rights, including all rights to any results or outcomes derived from such use, as our sole intellectual property. Commercial organisations are subject to the Terms of Use they have licenced. Please contact us at gyorffy(at)kmplot.com to obtain a license.
------------------------------------------------------------------------------------------------------------------------
We are A5 Genetics Ltd ("Company," "we," "us," "our"). We operate the website https://tnmplot.com/ (the "Site"), as well as any other related products and services that refer or link to these legal terms (the "Legal Terms") (collectively, the "Services"). You can contact us by email at gyorffy(at)kmplot.com.
These Legal Terms constitute a legally binding agreement made between you, whether personally or on behalf of an entity ("you"), and A5 Genetics Ltd concerning your access to and use of the Services. You agree that by accessing the Services, you have read, understood, and agreed to be bound by all of these Legal Terms. IF YOU DO NOT AGREE WITH ALL OF THESE LEGAL TERMS, THEN YOU ARE EXPRESSLY PROHIBITED FROM USING THE SERVICES AND YOU MUST DISCONTINUE USE IMMEDIATELY.
We reserve the right, in our sole discretion, to make changes or modifications to these Legal Terms from time to time. We will alert you about any changes by updating the "Last updated" date of these Legal Terms, and you waive any right to receive specific notice of each such change. It is your responsibility to periodically review these Legal Terms to stay informed of updates. You will be subject to, and will be deemed to have been made aware of and to have accepted, the changes in any revised Legal Terms by your continued use of the Services after the date such revised Legal Terms are posted.
The Services are intended for users who are at least 18 years old. Persons under the age of 18 are not permitted to use of the Services. We recommend that you print a copy of these Legal Terms for your records.
The information provided when using the Services is not intended for distribution to or use by any person or entity in any jurisdiction or country where such distribution or use would be contrary to law or regulation or which would subject us to any registration requirement within such jurisdiction or country. Accordingly, those persons who choose to access the Services from other locations do so on their own initiative and are solely responsible for compliance with local laws, if and to the extent local laws are applicable.
The Services are not tailored to comply with industry-specific regulations (Health Insurance Portability and Accountability Act (HIPAA), Federal Information Security Management Act (FISMA), etc.), so if your interactions would be subjected to such laws, you may not use the Services. You may not use the Services in a way that would violate the Gramm-Leach-Bliley Act (GLBA).
We are the owner or the licensee of all intellectual property rights in our Services, including all source code, integrated databases, functionality, software, website designs, video, text, and graphics in the Services (collectively, the "Content"), as well as the trademarks, service marks, and logos contained therein (the "Marks").
Our Content and Marks are protected by copyright and trademark laws (and various other intellectual property rights and unfair competition laws) and treaties in the United States and around the world.
The Content and Marks are provided in or through the Services "AS IS" for your personal, non-commercial use or academic purpose only.
Subject to your compliance with these Legal Terms, including the "PROHIBITED ACTIVITIES" section below, we grant you a non-exclusive, non- transferable, revocable license to access the Services; and to download or print a copy of any portion of the Content to which you have properly gained access solely for your personal, non-commercial use or academic purpose provided the original publications referenced in the portal are properly cited.
Except as set out in this section or elsewhere in our Legal Terms, no part of the Services and no Content or Marks may be copied, reproduced, aggregated, republished, uploaded, posted, publicly displayed, encoded, translated, transmitted, distributed, sold, licensed, or otherwise exploited for any commercial purpose whatsoever, without our express prior written permission.
If you wish to make any use of the Services, Content, or Marks other than as set out in this section or elsewhere in our Legal Terms, please address your request to: gyorffy(at)kmplot.com. If we ever grant you the permission to post, reproduce, or publicly display any part of our Services or Content, you must identify us as the owners or licensors of the Services, Content, or Marks and ensure that any copyright or proprietary notice appears or is visible on posting, reproducing, or displaying our Content.
We reserve all rights not expressly granted to you in and to the Services, Content, and Marks.
Any breach of these Intellectual Property Rights will constitute a material breach of our Legal Terms and your right to use our Services will terminate immediately.
Please review this section and the "PROHIBITED ACTIVITIES" section carefully prior to using our Services to understand the rights you give us. Submissions: By directly sending us any question, comment, suggestion, idea, feedback, or other information about the Services ("Submissions"), you agree to assign to us all intellectual property rights in such Submission. You agree that we shall own this Submission and be entitled to its unrestricted use and dissemination for any lawful purpose, commercial or otherwise, without acknowledgment or compensation to you.
You are solely responsible for your Submissions and you expressly agree to reimburse us for any and all losses that we may suffer because of your breach of (a) this section, (b) any third party's intellectual property rights, or (c) applicable law.
By using the Services, you represent and warrant that: (1) you have the legal capacity and you agree to comply with these Legal Terms; (2) you are not a minor in the jurisdiction in which you reside; (3) you will not access the Services through automated or non-human means, whether through a bot, script or otherwise; (4) you will not use the Services for any illegal or unauthorized purpose; and (5) your use of the Services will not violate any applicable law or regulation.
You may not access or use the Services for any purpose other than that for which we make the Services available. The Services may not be used in connection with any commercial endeavors except those that are specifically endorsed or approved by us.
- Systematically retrieve data or other content from the Services to create or compile, directly or indirectly, a collection, compilation, database, or directory without written permission from us.
- Circumvent, disable, or otherwise interfere with security-related features of the Services, including features that prevent or restrict the use or copying of any Content or enforce limitations on the use of the Services and/or the Content contained therein.
- Disparage, tarnish, or otherwise harm, in our opinion, us and/or the Services.
- Make improper use of our support services or submit false reports of abuse or misconduct.
- Use the Services in a manner inconsistent with any applicable laws or regulations.
- Upload or transmit (or attempt to upload or to transmit) viruses, Trojan horses, or other material, that interferes with any party's uninterrupted use and enjoyment of the Services or modifies, impairs, disrupts, alters, or interferes with the use, features, functions, operation, or maintenance of the Services.
- Engage in any automated use of the system, such as using scripts, or using any data mining, robots, or similar data gathering and extraction tools.
- Delete the copyright or other proprietary rights notice from any Content.
- Interfere with, disrupt, or create an undue burden on the Services or the networks or services connected to the Services.
- Attempt to bypass any measures of the Services designed to prevent or restrict access to the Services, or any portion of the Services.
- Copy or adapt the Services' software, including but not limited to R, PHP, HTML, JavaScript, or other code.
- Except as permitted by applicable law, decipher, decompile, disassemble, or reverse engineer any of the software comprising or in any way making up a part of the Services.
- Except as may be the result of standard search engine or Internet browser usage, use, launch, develop, or distribute any automated system, including without limitation, any spider, robot, cheat utility, scraper, or offline reader that accesses the Services, or use or launch any unauthorized script or other software.
- Use the Services as part of any effort to compete with us or otherwise use the Services and/or the Content for any revenue-generating endeavor or commercial enterprise.
The Services may contain (or you may be sent via the Site) links to other websites ("Third-Party Websites") as well as articles, photographs, text, graphics, pictures, designs, video, information, applications, software, and other content or items belonging to or originating from third parties ("Third-Party Content"). Such Third-Party Websites and Third-Party Content are not investigated, monitored, or checked for accuracy, appropriateness, or completeness by us, and we are not responsible for any Third-Party Websites accessed through the Services or any Third-Party Content posted on, available through, or installed from the Services, including the content, accuracy, offensiveness, opinions, reliability, privacy practices, or other policies of or contained in the Third-Party Websites or the Third-Party Content. Inclusion of, linking to, or permitting the use or installation of any Third-Party Websites or any Third-Party Content does not imply approval or endorsement thereof by us. If you decide to leave the Services and access the Third-Party Websites or to use or install any Third-Party Content, you do so at your own risk, and you should be aware these Legal Terms no longer govern. You should review the applicable terms and policies, including privacy and data gathering practices, of any website to which you navigate from the Services or relating to any applications you use or install from the Services. Any purchases you make through Third-Party Websites will be through other websites and from other companies, and we take no responsibility whatsoever in relation to such purchases which are exclusively between you and the applicable third party. You agree and acknowledge that we do not endorse the products or services offered on Third- Party Websites and you shall hold us blameless from any harm caused by your purchase of such products or services. Additionally, you shall hold us blameless from any losses sustained by you or harm caused to you relating to or resulting in any way from any Third-Party Content or any contact with Third-Party Websites.
We reserve the right, but not the obligation, to: (1) monitor the Services for violations of these Legal Terms; (2) take appropriate legal action against anyone who, in our sole discretion, violates the law or these Legal Terms, including without limitation, reporting such user to law enforcement authorities; (3) in our sole discretion and without limitation, refuse, restrict access to, limit the availability of, or disable (to the extent technologically feasible) any of your Contributions or any portion thereof; (4) in our sole discretion and without limitation, notice, or liability, to remove from the Services or otherwise disable all files and content that are excessive in size or are in any way burdensome to our systems; and (5) otherwise manage the Services in a manner designed to protect our rights and property and to facilitate the proper functioning of the Services.
These Legal Terms shall remain in full force and effect while you use the Services. WITHOUT LIMITING ANY OTHER PROVISION OF THESE LEGAL TERMS, WE RESERVE THE RIGHT TO, IN OUR SOLE DISCRETION AND WITHOUT NOTICE OR LIABILITY, DENY ACCESS TO AND USE OF THE SERVICES (INCLUDING BLOCKING CERTAIN IP ADDRESSES), TO ANY PERSON FOR ANY REASON OR FOR NO REASON, INCLUDING WITHOUT LIMITATION FOR BREACH OF ANY REPRESENTATION, WARRANTY, OR COVENANT CONTAINED IN THESE LEGAL TERMS OR OF ANY APPLICABLE LAW OR REGULATION. WE MAY TERMINATE YOUR USE OR PARTICIPATION IN THE SERVICES, WITHOUT WARNING, IN OUR SOLE DISCRETION.
We reserve the right to change, modify, or remove the contents of the Services at any time or for any reason at our sole discretion without notice. However, we have no obligation to update any information on our Services. We will not be liable to you or any third party for any modification, suspension, or discontinuance of the Services.
We cannot guarantee the Services will be available at all times. We may experience hardware, software, or other problems or need to perform maintenance related to the Services, resulting in interruptions, delays, or errors. We reserve the right to change, revise, update, suspend, discontinue, or otherwise modify the Services at any time or for any reason without notice to you. You agree that we have no liability whatsoever for any loss, damage, or inconvenience caused by your inability to access or use the Services during any downtime or discontinuance of the Services. Nothing in these Legal Terms will be construed to obligate us to maintain and support the Services or to supply any corrections, updates, or releases in connection therewith.
By accessing or using the software, users irrevocably agreed that these Terms of Use shall be governed by and construed in accordance with the laws of Hungary, without regard to its conflict of laws rules. Users further consent to the exclusive jurisdiction of the courts of Budapest, Hungary, for the resolution of any disputes arising out of or relating to these Terms or the use of the software.
The European Commission provides an online dispute resolution platform, which you can access. If you would like to bring this subject to our attention, please contact us.
There may be information on the Services that contains typographical errors, inaccuracies, or omissions, including descriptions, availability, and various other information. We reserve the right to correct any errors, inaccuracies, or omissions and to change or update the information on the Services at any time, without prior notice.
THE SERVICES ARE PROVIDED ON AN AS-IS AND AS-AVAILABLE BASIS. YOU AGREE THAT YOUR USE OF THE SERVICES WILL BE AT YOUR SOLE RISK. TO THE FULLEST EXTENT PERMITTED BY LAW, WE DISCLAIM ALL WARRANTIES, EXPRESS OR IMPLIED, IN CONNECTION WITH THE SERVICES AND YOUR USE THEREOF, INCLUDING, WITHOUT LIMITATION, THE IMPLIED WARRANTIES OF MERCHANTABILITY, FITNESS FOR A PARTICULAR PURPOSE, AND NON-INFRINGEMENT. WE MAKE NO WARRANTIES OR REPRESENTATIONS ABOUT THE ACCURACY OR COMPLETENESS OF THE SERVICES' CONTENT OR THE CONTENT OF ANY WEBSITES OR MOBILE APPLICATIONS LINKED TO THE SERVICES AND WE WILL ASSUME NO LIABILITY OR RESPONSIBILITY FOR ANY (1) ERRORS, MISTAKES, OR INACCURACIES OF CONTENT AND MATERIALS, (2) PERSONAL INJURY OR PROPERTY DAMAGE, OF ANY NATURE WHATSOEVER, RESULTING FROM YOUR ACCESS TO AND USE OF THE SERVICES, (3) ANY UNAUTHORIZED ACCESS TO OR USE OF OUR SECURE SERVERS AND/OR ANY AND ALL PERSONAL INFORMATION AND/OR FINANCIAL INFORMATION STORED THEREIN, (4) ANY INTERRUPTION OR CESSATION OF TRANSMISSION TO OR FROM THE SERVICES, (5) ANY BUGS, VIRUSES, TROJAN HORSES, OR THE LIKE WHICH MAY BE TRANSMITTED TO OR THROUGH THE SERVICES BY ANY THIRD PARTY, AND/OR (6) ANY ERRORS OR OMISSIONS IN ANY CONTENT AND MATERIALS OR FOR ANY LOSS OR DAMAGE OF ANY KIND INCURRED AS A RESULT OF THE USE OF ANY CONTENT POSTED, TRANSMITTED, OR OTHERWISE MADE AVAILABLE VIA THE SERVICES. WE DO NOT WARRANT, ENDORSE, GUARANTEE, OR ASSUME RESPONSIBILITY FOR ANY PRODUCT OR SERVICE ADVERTISED OR OFFERED BY A THIRD PARTY THROUGH THE SERVICES, ANY HYPERLINKED WEBSITE, OR ANY WEBSITE OR MOBILE APPLICATION FEATURED IN ANY BANNER OR OTHER ADVERTISING, AND WE WILL NOT BE A PARTY TO OR IN ANY WAY BE RESPONSIBLE FOR MONITORING ANY TRANSACTION BETWEEN YOU AND ANY THIRD- PARTY PROVIDERS OF PRODUCTS OR SERVICES. AS WITH THE PURCHASE OF A PRODUCT OR SERVICE THROUGH ANY MEDIUM OR IN ANY ENVIRONMENT, YOU SHOULD USE YOUR BEST JUDGMENT AND EXERCISE CAUTION WHERE APPROPRIATE.
IN NO EVENT WILL WE OR OUR DIRECTORS, EMPLOYEES, OR AGENTS BE LIABLE TO YOU OR ANY THIRD PARTY FOR ANY DIRECT, INDIRECT, CONSEQUENTIAL, EXEMPLARY, INCIDENTAL, SPECIAL, OR PUNITIVE DAMAGES, INCLUDING LOST PROFIT, LOST REVENUE, LOSS OF DATA, OR OTHER DAMAGES ARISING FROM YOUR USE OF THE SERVICES, EVEN IF WE HAVE BEEN ADVISED OF THE POSSIBILITY OF SUCH DAMAGES.
You agree to defend, indemnify, and hold us harmless, including our subsidiaries, affiliates, and all of our respective officers, agents, partners, and employees, from and against any loss, damage, liability, claim, or demand, including reasonable attorneys' fees and expenses, made by any third party due to or arising out of: (1) use of the Services; (2) breach of these Legal Terms; (3) any breach of your representations and warranties set forth in these Legal Terms; (4) your violation of the rights of a third party, including but not limited to intellectual property rights; or (5) any overt harmful act toward any other user of the Services with whom you connected via the Services. Notwithstanding the foregoing, we reserve the right, at your expense, to assume the exclusive defense and control of any matter for which you are required to indemnify us, and you agree to cooperate, at your expense, with our defense of such claims. We will use reasonable efforts to notify you of any such claim, action, or proceeding which is subject to this indemnification upon becoming aware of it.
We will maintain certain data that you transmit to the Services for the purpose of managing the performance of the Services, as well as data relating to your use of the Services. Although we perform regular routine backups of data, you are solely responsible for all data that you transmit or that relates to any activity you have undertaken using the Services. You agree that we shall have no liability to you for any loss or corruption of any such data, and you hereby waive any right of action against us arising from any such loss or corruption of such data.
Visiting the Services, sending us emails, and completing online forms constitute electronic communications. You consent to receive electronic communications, and you agree that all agreements, notices, disclosures, and other communications we provide to you electronically, via email and on the Services, satisfy any legal requirement that such communication be in writing. YOU HEREBY AGREE TO THE USE OF ELECTRONIC SIGNATURES, CONTRACTS, ORDERS, AND OTHER RECORDS, AND TO ELECTRONIC DELIVERY OF NOTICES, POLICIES, AND RECORDS OF TRANSACTIONS INITIATED OR COMPLETED BY US OR VIA THE SERVICES. You hereby waive any rights or requirements under any statutes, regulations, rules, ordinances, or other laws in any jurisdiction which require an original signature or delivery or retention of non-electronic records, or to payments or the granting of credits by any means other than electronic means.
If any complaint with us is not satisfactorily resolved, you can contact the Complaint Assistance Unit of the Division of Consumer Services of the California Department of Consumer Affairs in writing at 1625 North Market Blvd., Suite N 112, Sacramento, California 95834 or by telephone at (800) 952-5210 or (916) 445-1254.
These Legal Terms and any policies or operating rules posted by us on the Services or in respect to the Services constitute the entire agreement and understanding between you and us. Our failure to exercise or enforce any right or provision of these Legal Terms shall not operate as a waiver of such right or provision. These Legal Terms operate to the fullest extent permissible by law. We may assign any or all of our rights and obligations to others at any time. We shall not be responsible or liable for any loss, damage, delay, or failure to act caused by any cause beyond our reasonable control. If any provision or part of a provision of these Legal Terms is determined to be unlawful, void, or unenforceable, that provision or part of the provision is deemed severable from these Legal Terms and does not affect the validity and enforceability of any remaining provisions. There is no joint venture, partnership, employment or agency relationship created between you and us as a result of these Legal Terms or use of the Services. You agree that these Legal Terms will not be construed against us by virtue of having drafted them. You hereby waive any and all defenses you may have based on the electronic form of these Legal Terms and the lack of signing by the parties hereto to execute these Legal Terms.
If you have any further quesitons, please contact us at: gyorffy(at)kmplot.com
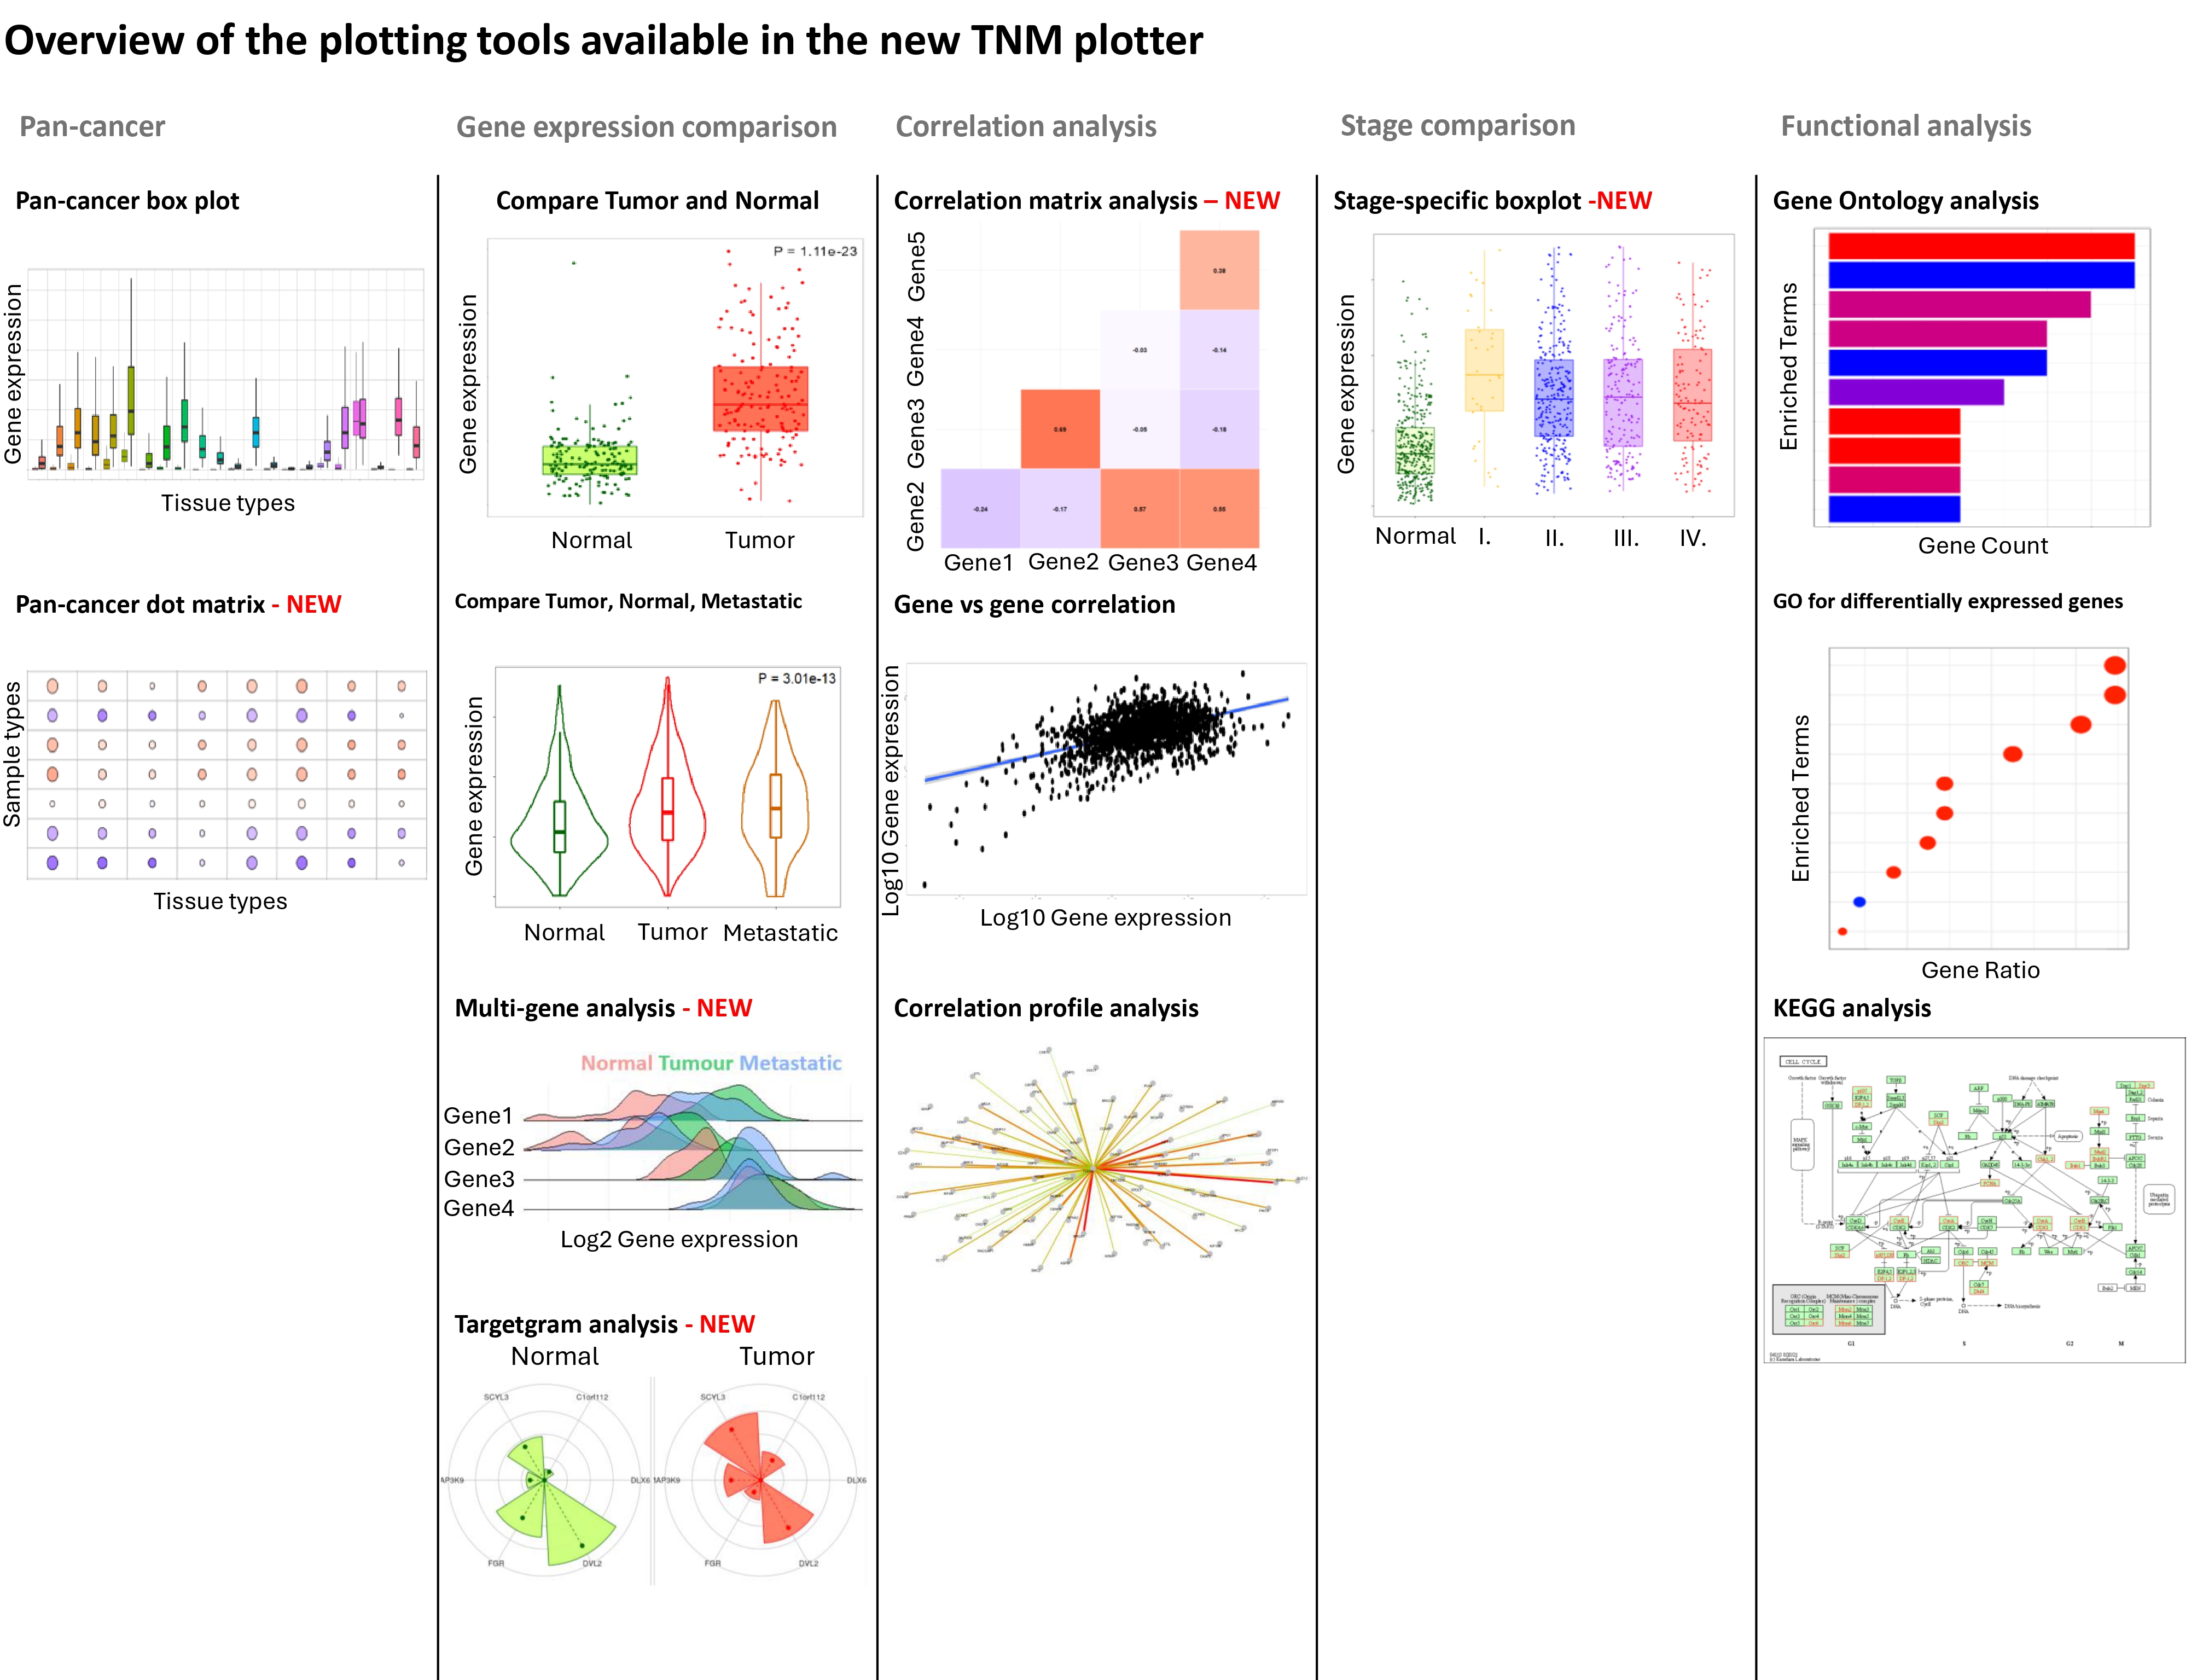
TNMplot v2 is an advanced web-based platform designed for transcriptomic analysis, integrating RNA-Seq and gene-chip data from 57 thousand samples. It facilitates differential gene expression analysis across normal, primary tumor, and metastatic tissues, supporting over 20 tumor types with publication-ready visualizations. The new TNMplot v2 introduces stage-specific analysis, multi-gene analysis, correlation analysis tools, and expanded visualization features.
- The pan-cancer analysis page displays the expression range for a selected gene across all tissues using RNA Seq data from normal and cancer tissues.
- The pan-cancer dot matrix analysis page displays log2 FC values of tumor/normal RNA-Seq data, red color represents higher expression in tumor, while the blue color indicates higher expression in normal tissues. The sizes of the circles are inversely proportional to the adjusted P values.
- TN-plot: the Normal and Tumor analysis page provides detailed analysis for a selected gene in a selected tissue type using RNA-seq and gene chip based data.
- TNM-plot: The Normal, Tumor and Metastatic analysis page provides detailed analysis for a selected gene in a selected tissue type using RNA-Seq and gene chip based data.
- Multi-Gene Analysis: Compare multiple genes simultaneously using density plots and box plots in both RNA-seq and gene chip datasets.
- Targetgram analysis: provides an overview of the selected gene set in the selected tissue using gene chip and RNA-Seq based data, the size of the segments represent the mean values, length of the dashed lines represent the median values of each types.
- Gene Signature Analysis: Analyze predefined gene signatures and their expression patterns. This papge page calculates the means of the selected gene signature across each patient one by one and provides a summary plot.
- Gene vs. Gene Correlation: Compare the correlation of two selected genes using multiple correlation methods in the selected tissue type.
- Correlation Matrix: Analyze relationships between multiple genes, and explore the correlation matrix of a selected gene set in the selected tissue type
- Correlation Profile Analysis: Explore correlation network for a selected gene by browsing all the genes showing correlation with the input gene in the selected tissue type.
- Stage-Specific Analysis: Investigate gene expression across different tumor stages.
- Functional analysis: perform GO or KEGG enrichment analysis
TNMplot v2 integrates transcriptomic data from multiple reputable sources:
- Genomic Data Commons (GDC): RNA-seq data from TCGA (adult tumors) and TARGET (pediatric tumors).
- Genotype-Tissue Expression (GTEx): Normal reference tissues.
- NCBI Gene Expression Omnibus (GEO): Manually curated gene chip datasets (>33,000 samples).
Choose the dataset type (RNA-seq or gene-chip).
Select a gene from the input field.
Select the comparison type (e.g., normal vs. tumor, tumor vs. metastatic).
Generate visualizations and download results in publication-ready formats.
TNMplot provides both gene array (from GEO) and RNA-seq data (from TCGA, TARGET, and GTEx), each with distinct advantages:
Gene Array Data:
RNA-Seq Data:
Recommended Approach:
We strongly recommend performing analyses using both platforms whenever possible. Consistent findings across both gene array and RNA-seq data provide robust cross-platform validation and increase confidence in biological relevance. If results differ between platforms, this may indicate platform-specific biases, batch effects, or population differences that warrant further investigation. Start with one platform for initial discovery, then validate findings using the other platform to ensure reproducibility across independent patient cohorts and technologies.
- Stage Comparison Analysis: Select a tumor type and analyze gene expression across stages I-IV.
- Multi-Gene Input: Simultaneously analyze multiple genes within a dataset.
- Correlation Analysis: Investigate relationships between genes within selected tissue types.
- Gene Signature Analysis: Evaluate expression trends of predefined gene sets.
- Supported Browsers: Chrome, Firefox, Edge, Safari.
- No software installation required (runs directly in the browser).
For inquiries, bug reports, or support, contact:
- gyorffy@kmplot.com
If you use TNMplot in your research, please cite:
- Bartha Á, Győrffy B. TNMplot.com: A Web Tool for the Comparison of Gene Expression in Normal, Tumor, and Metastatic Tissues. *Int J Mol Sci.* 2021; 22(5):2622.
TNMplot will continue to be maintained and expanded. Future updates may include:
- Additional tumor types and dataset expansions.
- New analytical methods for biomarker discovery.